

Online trading major Interactive Brokers continues to expand the capabilities of its recently launched IBKR Desktop platform. Version 0.08 of IBKR Desktop includes a number of improvements.
MultiSort Screeners allow users to find and sort data using multiple factors simultaneously. Interactive Brokers has enhanced the screeners to include:
Histograms: Use the histogram filter on any factor to adjust the value range. Use the filter icon to display the histogram for a factor. When using multiple factors, histograms display “slider handles” on both sides that make it easy to modify the range. When you modify a range for one factor, the results for other factors are affected.
For example, if you drag to set Dividends to a range of 0.08 to 0.49, this will affect shares returned with a last price between 2.37 and 64.94.
Color Ranking: Easily see which instruments and prices are “Most Preferred” or “Least Preferred” based on selected factors and factor attributes. Activate by clicking Color Rank in the upper right corner of the screen. Note that assets and values are often classified separately. In the image above, the instrument ranked #1 includes the last “Least Preferred” value and P/E.
![]()
![]()
To create a MultiSort Screener
- Select Screeners from the left navigation panel.
- In the Display Type panel, click MultiSort.
- Add up to 10 factors. If you have a preference, set the factor to prefer higher or lower values. If you set a value preference, you can also specify whether the factor is Important (default), Very Important, or Somewhat Important.
Embedded Order Modifications
You can now modify the Price and Quantity for a work order directly on the order line in the Orders & Transactions tab.
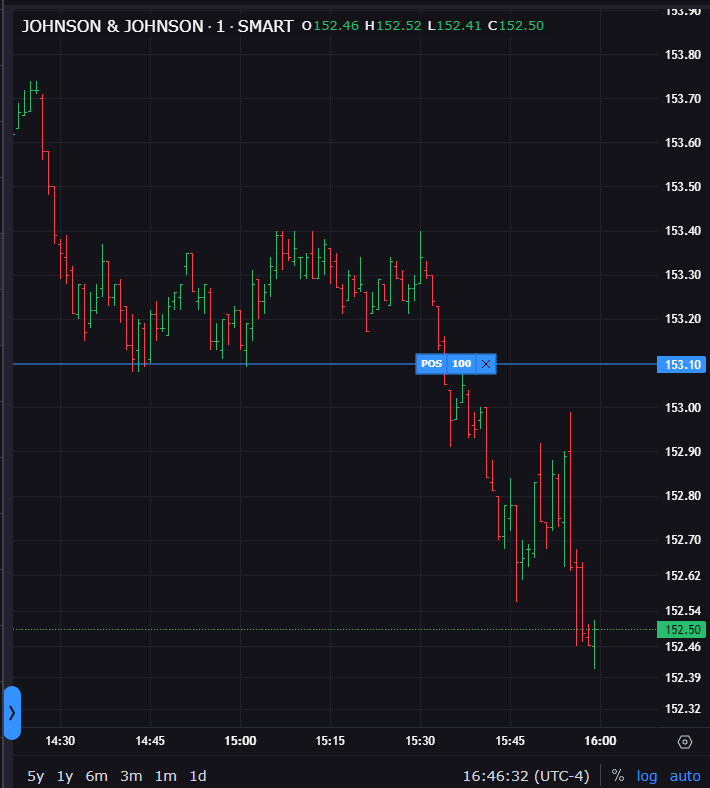
Average price indicator on charts
You can now see the Position (in a rectangle) and the Average Price (connected to the position via a horizontal line and boxed on the Price axis) on your chart. Both the line and box will be blue for long positions and red for short positions.
Note that if the current price and average price of your position are too far apart, you may need to adjust the price scale to see both. To do this, place your mouse at the top of the Y-axis until the cursor becomes two arrows. Click and hold, then drag the price bar down until the current price and average price are close enough to see both on the chart.
To disable this feature, click the gear icon to open the Chart Settings and from the Trades menu uncheck “Positions”.
IBKR Desktop is built from the ground up using a more modern UI framework with simplified navigation. The perfect alternative for active customers who prefer a lighter platform, IBKR Desktop includes the most popular tools from our flagship TWS with the same great order execution.