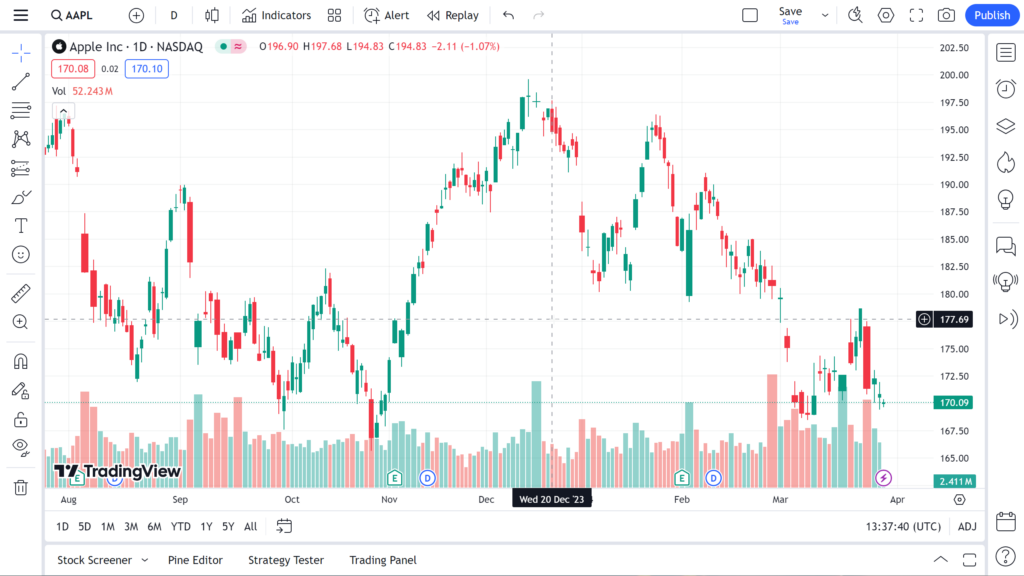
In response to many user requests, TradingView has added a new chart type — Volume Candles.
Now, traders can visually check the trading volume for each candle. With this new chart type, they will see candlesticks, but the width of each candle is based on the trading volume during the period of that candle’s formation.
Thus, the greater the trading volume during the formation period, the wider the candle.


You can select candlesticks as a chart type from the menu on the top toolbar.
Note that the new chart type is available to users with a Premium subscription or higher.
TradingView expands the range of chart types available to users of the platform. A recent addition is the HLC area. This chart type is based on three price values: High, Low and Close. It allows you to focus on the most important data and ignore the open price value that is less important for analysis.
If it is more useful for you to see the range of price movement over a selected interval, the HLC area chart type in the form of a shaded area is at your disposal.

