
TradingView has added Volume Footprint to its array of chart types.
The new volume footprint chart type for Premium and higher tier plans shows the distribution of trading volume at various price levels on each bar. The information from this type of chart helps traders analyze the buy/sell balance at all levels within each bar and identify areas of significant liquidity.
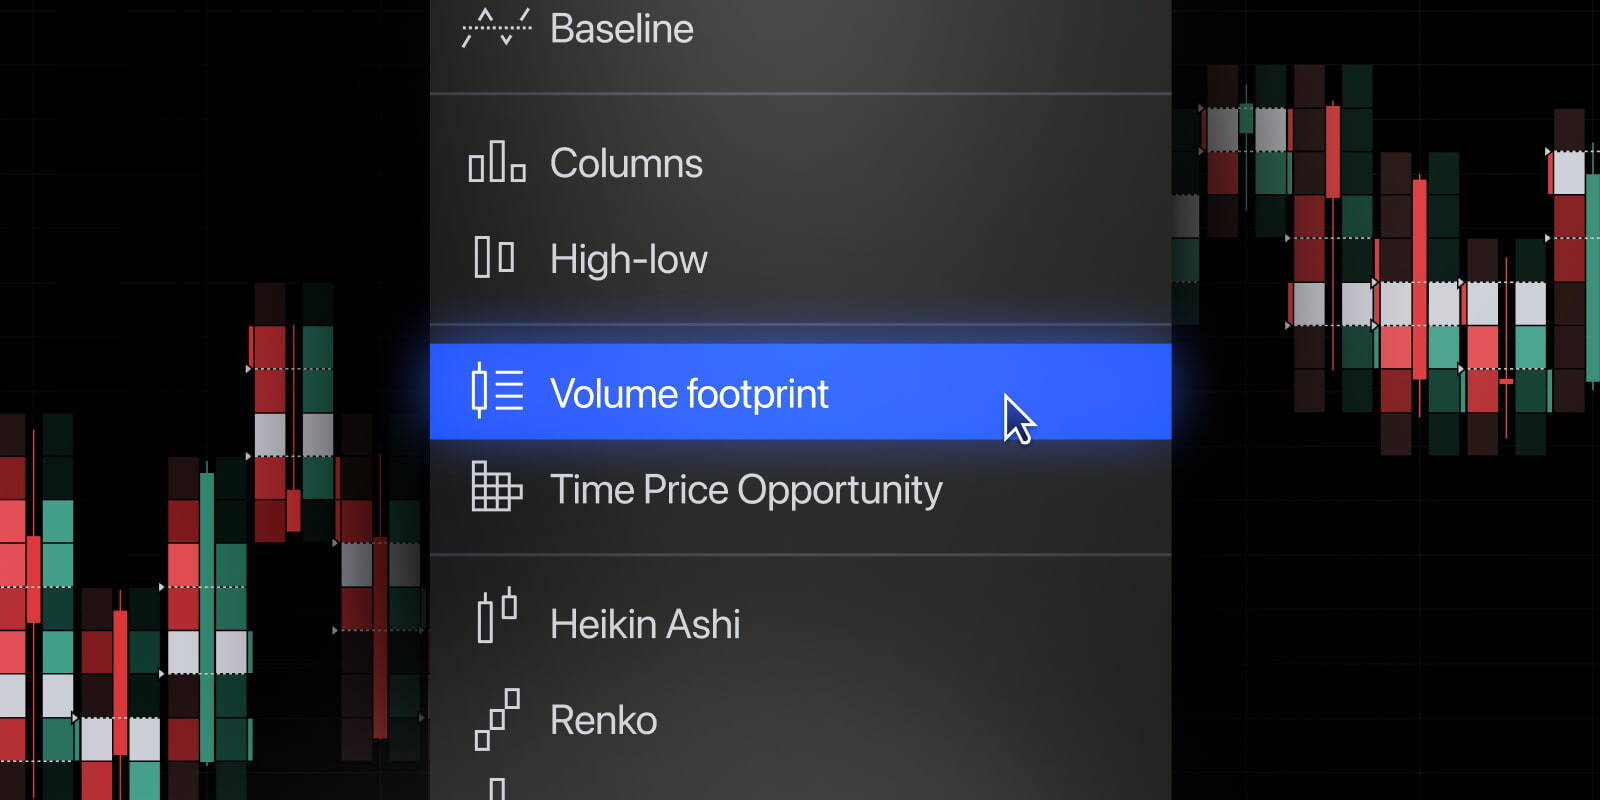
To view volume footprints on your chart, select “Volume footprint” from the chart type drop-down menu:

The chart will display a footprint for each bar with available volume data within the bar:
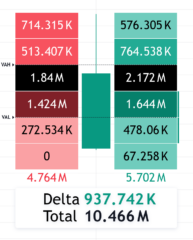
The default view shows the distribution of sales volume on the left of each line and buy volume on the right. Gradient colors reflect the relative intensity of each level’s selling and buying volume, and lines next to the distributions indicate levels of significant imbalance.
Each side of the footprint also highlights the Point of Control (POC), i.e. the level with the highest trading volume. In addition, the chart displays delta volume and total volume information below each line.
Comparing volume prices from both sides of a footprint allows you to assess the balance between buying and selling activity at all levels and assess how the distribution of trading activity relates to price action. Unpacking the bars in this way can provide a more detailed picture of what is happening during the course of a bar and help you determine how strongly buying or selling pressure is supporting price movements.
TradingView recently added two new volume-based indicators, Volume Delta and Cumulative Volume Delta.
These indicators use volume and price fluctuations within bars to estimate the difference (delta) between buying and selling pressure on each chart line, providing insight into an instrument’s sentiment and market dynamics.